
To plan for a bright financial future, you have to understand credit scores and identity theft prevention. Lenders use your credit score to decide if you’re creditworthy, so it’s important to know where you stand compared to other consumers and be proactive.
You can also be proactive by protecting yourself from identity theft. If your personal information is stolen, it could affect not only your credit score, but also cause you to lose money, time, and your patience.
These statistics will help you stay vigilant about your personal finances, assess how your credit score compares to the rest of the country, and learn how to curb the risk of identity theft. If you have questions or need help monitoring your credit to avoid identity theft, call us at .
Credit score statistics: Scores by State
Every year, Experian researches credit scores in the U.S. Take a look back at how credit changed (mostly for the better) in 2024.
- Alabama average credit score: 692
- Alaska average credit score: 722
- Arizona average credit score: 712
- Arkansas average credit score: 695
- California average credit score: 722
- Colorado average credit score: 731
- Connecticut average credit score: 726
- Delaware average credit score: 714
- District of Columbia average credit score: 715
- Florida average credit score: 707
- Georgia average credit score: 695
- Hawaii average credit score: 732
- Idaho average credit score: 730
- Illinois average credit score: 720
- Indiana average credit score: 712
- Iowa average credit score: 730
- Kansas average credit score: 722
- Kentucky average credit score: 705
- Louisiana average credit score: 690
- Maine average credit score: 731
- Maryland average credit score: 715
- Massachusetts average credit score: 732
- Michigan average credit score: 719
- Minnesota average credit score: 742
- Mississippi average credit score: 680
- Missouri average credit score: 714
- Montana average credit score: 732
- Nebraska average credit score: 731
- Nevada average credit score: 701
- New Hampshire average credit score: 736
- New Jersey average credit score: 724
- New Mexico average credit score: 702
- New York average credit score: 721
- North Carolina average credit score: 709
- North Dakota average credit score: 733
- Ohio average credit score: 716
- Oklahoma average credit score: 696
- Oregon average credit score: 732
- Pennsylvania average credit score: 722
- Rhode Island average credit score: 721
- South Carolina average credit score: 700
- South Dakota average credit score: 734
- Tennessee average credit score: 706
- Texas average credit score: 695
- Utah average credit score: 730
- Vermont average credit score: 737
- Virginia average credit score: 723
- Washington average credit score: 735
- West Virginia average credit score: 702
- Wisconsin average credit score: 738
- Wyoming average credit score: 725
2024 general credit score fast facts[1]
- The average FICO Score in the U.S. rose to 715 in 2023 and has since stayed the same in 2024. After four consecutive years of increases, this is the second time it has remained the same since 2010 to 2011.
- In 2024, scores increased in all age groups except the Silent Generation and Gen Z. For the first time, the average FICO Score of Generation X in 2021 was in the 700s (698 to 705) and has stayed in the 700s, now at 709.
- The silent generation, with the best average credit score, stayed the same after a jump in 2021 (758 to 760)
- The average score of millennials increased one point from 2023 to 2024 (690 to 691). The youngest consumers in Generation Z jumped a point in 2024, and the average score of baby boomers increased one points (745 to 746).
- In 2024, the average credit card utilization ratio was 29%, no jump from 2023’s rate of 29%.
- Nationwide, 2.40% of all credit card accounts are in some stage of delinquency, down from 2.45% in 2023.
Identity theft statistics in the United States
Fraud, Identity Theft and other Reports by Year
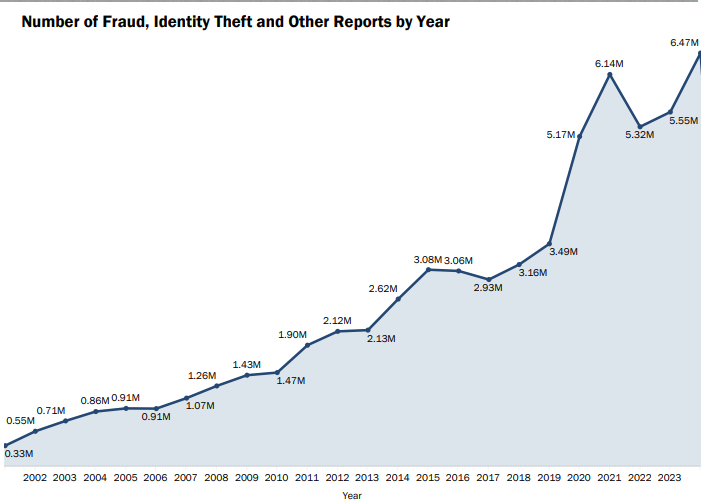
The latest and most comprehensive stats on identity theft are from 2024. The Federal Trade Commission reported the total number of Identity Theft reports for 2024 was 1,135,291, while total reported frauds stood at 2,600,678. Here are some other interesting highlights:
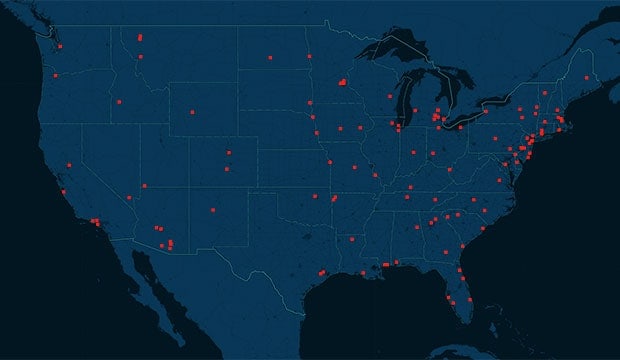
2024 identity theft by state:[2]
- State with the most identity theft cases: Florida – 528 victims per 100k population[2]
- State with the least identity theft cases: South Dakota – 94 victims per 100k population[2]
2024 identity theft by gender:[3]
Victims are primarily married women spread evenly across all adult age groups:
- Men: 37%
- Women: 63%
However, research from the Bureau of Justice Statistics (BJS) showed that men and women were equally likely to be identity theft victims at 9% each.
2024 identity theft by age:[2]
- Age 19 & Under: 21,240 reports
- Age 20-29: 187,194 reports
- Age 30-39: 291,807 reports
- Age 40-49: 207,658 reports
- Age 50-59: 135,758 reports
- Age 60-69: 83,485 reports
- Age 70-79: 36,790 reports
- Age 80+: 9,605 reports
2024 identity theft race/ethnicity:[3]
According to the ITRC, in terms of race and origin, victims skew higher than the US population among White non-Hispanic, African-American, and Native American populations, but slightly lower among Asian Americans / Pacific Islanders and significantly lower among victims of Hispanic origin.
- Caucasian/White: 65%
- African American/Black: 17%
- Asian American/Pacific Islander: 7%
- Hispanic: 7%
- Native American: 4%
2024 identity theft by income:[3]
The number of victims who self-report low annual income nearly matches the number of victims who report high annual earnings.
- Less than $20,000: 17%
- $20,000 – $29,999: 14%
- $30,000 – $49,999: 13%
- $50,000 – $75,000: 12%
- More than $75,000: 21%
- No response: 23%
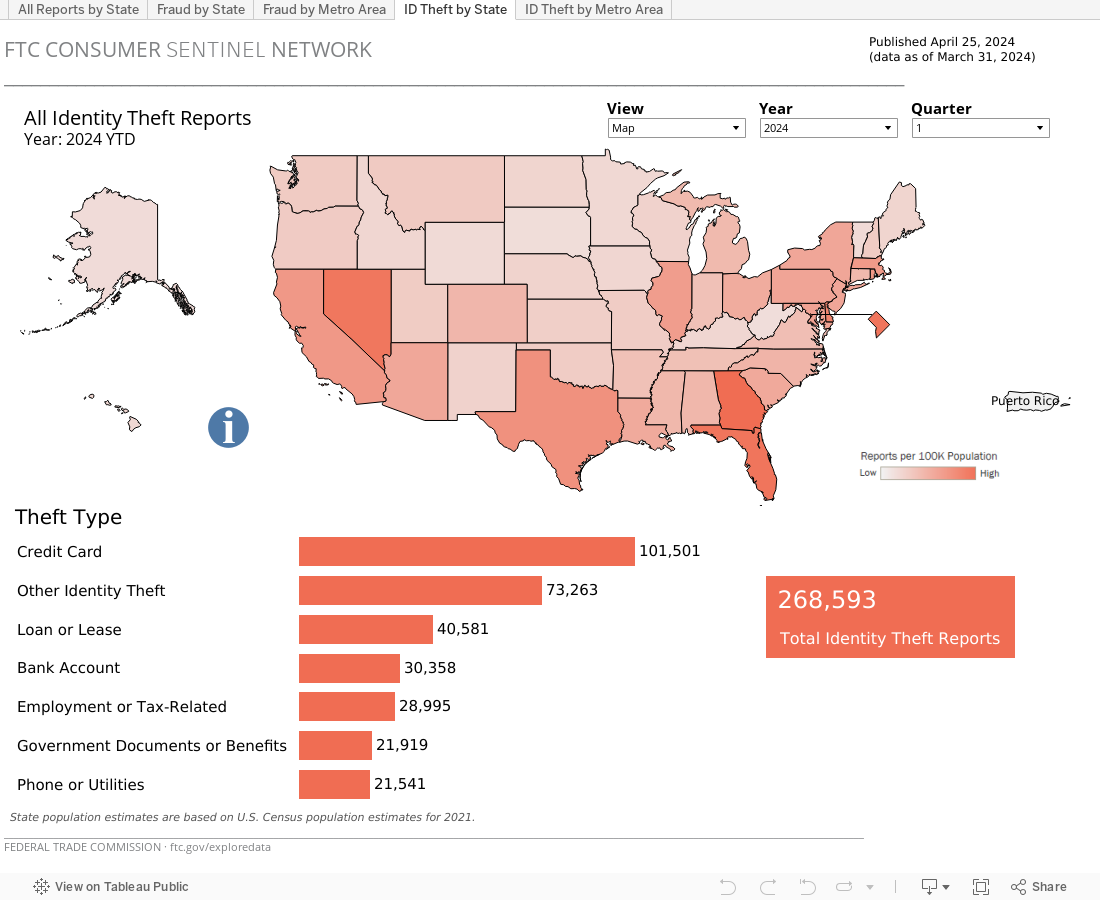
Most Common Types of Identity Theft:[2]
According to the Consumer Sentinel Network Data Book of 2024, Government Documents or Benefits Fraud tops the list of identity theft types reported in 2023. The FTC received 395,948 reports from people who said their information was misused to apply for a government document or benefit, such as unemployment insurance.
The Top 3 Types of Identity theft reports of 2023 & 2024 (from least to greatest) are as follows:
Fraud Type: | 2023 Reports: | 2024 Reports: |
Percent Change: |
|---|---|---|---|
Loan or Lease |
205,072
|
197,914
|
-3.49%
|
Credit Card | 416,579 | 449,032 | +0.92% |
Gov Docs or Benefits |
407,512
|
395,948
|
-2.83%
|
Financial impact of theft
According to the FTC, consumers reported losing more than $12.5 billion to fraud in 2024, an increase of 25 percent over the previous year.[2]
- Of those losses reported by consumers, more than $2.3 billion of losses reported last year were due to imposter scams—similar to in 2023, while online shopping accounted for about $392 million in reported losses from consumers—up from $246 million in 2023.[4]
Younger people reported losing money to fraud 20% more often than older people.[2]
- Ages 20-29: 44%
- Ages 70-79: 24%
However, when people aged 70+ did have a fraud related financial loss, the median loss was much higher.[2]
- Ages 20-29: $417
- Ages 70-79: $1,000
- Age 80+: $1,650
The ITRC Consumer Aftermath Report claimed that most victims lose less than $500, but 21% say they lost more than $20,000 to identity criminals.[3]
Finance & beyond
Most identity crime victims require at least one month, while some need one year or more to resolve their identity issues.
- Only 1% of victims who contacted the ITRC can resolve their issues in a single day
- 37% of pre-pandemic identity crime victims said their issues from 2019 were not resolved as of May 2020
- 75% of victims of pandemic-related identity fraud in 2020 said their issues were still unresolved as of April 2021
There is a sizable number of repeat victims; Three out of ten (29%) of victims have been repeat victims of an identity theft crime.
- As a result of Covid-19 related identity theft (financial impact):
- 40% reported being unable to pay their routine monthly bills
- 33% reported not having funds to buy food or pay utilities
- 14% reported being evicted for failing to pay rent or mortgage
- 14% reported not being able to make their car payment
- 8% reported not being able to afford child or elder care
- As a result of Covid-19 related identity theft (non-financial impact):
- 54% reported feeling more stressed than usual
- 54% reported feeling violated
- 43% reported feeling powerless or helpless
- 37% reported feeling they trust people less
- 19% reported arguing more often with family & friends